
監控網路與儲存設備 with SNMP Trap
- You do not have permissions to view this page - please try logging in.
更多文章
說明
本篇將說明如何用 Nagios 監控有支援 SNMP Trap 的 IT 設備,比如 Cisco 網路設備或 IBM V7000 儲存設備。
SNMP Trap 與 SNMP 最大不同就是應用面,一者用於設備故障時發出警示事件,另一個則用於蒐集系統各項資訊,例如網路頻寬、CPU/RAM 耗用資訊等等。
本例就以 IBM V7000 儲存設備為例,也附上 Cisco 網路設備的做法。
各項原件 Nagios、SNMPTT、snmptrapd 彼此運作原理大致如下:

系統環境:
- Nagios Core 3.x
- IBM V7000 儲存設備
- QNAP NAS 設備
事前準備
- 已安裝 Nagios Core 或 XI 版
- 已安裝 SNMPTT 套件
- 被監控的設備需提供 MIB 檔案,如附檔區。
設定 Nagios
新增 SNMP_TRAP 服務的範本
TIP:
max_check_attempts 要設為 1,因為被監控的設備一般只會發出一次的 snmp trap,如果設定值大於 1 警告郵件就不會寄出。
#> /etc/nagios/objects/templates.cfg

define service {
  name                            SNMP_TRAP
  service_description             SNMP_TRAP
  active_checks_enabled           1       ; Active service checks are enabled
  passive_checks_enabled          1       ; Passive service checks are enabled/accepted
  parallelize_check               1       ; Active service checks should be parallelized
  process_perf_data               0
  obsess_over_service             0       ; We should obsess over this service (if necessary)
  check_freshness                 0       ; Default is to NOT check service 'freshness'
  notifications_enabled           1       ; Service notifications are enabled
  event_handler_enabled           1       ; Service event handler is enabled
  flap_detection_enabled          1       ; Flap detection is enabled
  process_perf_data               1       ; Process performance data
  retain_status_information       1       ; Retain status information across program restarts
  retain_nonstatus_information    1       ; Retain non-status information across program restarts
  check_command                   check-host-alive      ; This will be used to reset the service to "OK"
  is_volatile                     1
  check_period                    24x7
  max_check_attempts             1
  normal_check_interval           1
  retry_check_interval            1
  notification_interval           120
  notification_period             24x7
  notification_options            w,u,c,r
  contact_groups                  netops-24x7       ; Modify this to match your Nagios contact group definitions
  register                        0
  }
新增 V7000 主機檢查檔
TIP:
服務定義檔的 check_interval 建議保持 120 分鐘,這裡的時間決定了網頁上的 CRITICAL 狀態要保持多久,過了這個時間後,服務狀態會自動恢復為 OK;假使想立即解除 CRITICAL 狀態,可以進入該服務的頁面,從右框執行 Re-schedule the next check of this service。
#> vi /etc/nagios/objects/STORAGES.cfg

define host{
        use                     generic-host
        host_name               ibm_v7k01
        alias                   IBM V7000 #1
        address                 10.4.1.51
        check_command           check-host-alive
        max_check_attempts      5
        check_period            24x7
        notification_interval   120
        notification_period     24x7
        notification_options    d,r
        contact_groups          adm-alang
        notifications_enabled   1      ;0=disable, 1=enable
        }

define hostgroup{
        hostgroup_name  fs-storage
        alias           FileServer Storages
        members         ibm_v7k01
        }

define service {
       use                      SNMP_TRAP
       host_name                ibm_v7k01
       service_description      SNMP_TRAP
       check_interval           120 ; Don't clear for 2 hours
       contact_groups           adm-alang
       notifications_enabled    1
       }
套用設定
#> service nagios reload
模擬主機異常發生的測試
#> /usr/lib64/nagios/plugins/eventhandlers/submit_check_result ibm_v7k01 SNMP_TRAP 2 "TESTING"
NOTE: 以上指令可以模擬發出如下的異常資訊,可以從 Nagios 網頁上檢視異常發生,等一會兒後,網頁上狀況會自動恢復成正常。
異常主機: ibm_v7k01
異常服務: SNMP_TRAP
狀況代碼: 2 = Critical
輸出資訊: TESTING
指令 submit_check_result 更多說明
# $1 = host_name (Short name of host that the service is
# associated with)
# $2 = svc_description (Description of the service)
# $3 = return_code (An integer that determines the state
# of the service check, 0=OK, 1=WARNING, 2=CRITICAL,
# 3=UNKNOWN).
# $4 = plugin_output (A text string that should be used
# as the plugin output for the service check)
修改 Nagios 指令 submit_check_result
#> vi /usr/lib64/nagios/plugins/eventhandlers/submit_check_result

第一行 #!/bin/sh 改成 #!/bin/bash
下載並上傳 MIB 檔
#> cp SVC_MIB_7.5.0.MIB /usr/share/snmp/mibs/SVC_MIB_7.5.0.MIB.txt
TIPs:
如果是下載 Cisco 網路設備的 MIB 可以前往 ftp://ftp.cisco.com/pub/mibs/v2/
設定 snmptrapd
#> vi /etc/snmp/snmptrapd.conf

disableAuthorization yes
traphandle default /usr/sbin/snmptthandler
套用設定
#> service snmptrapd restart
轉換 MIB 成 snmptt 設定檔
#> snmpttconvertmib --in=/usr/share/snmp/mibs/SVC_MIB_7.5.0.MIB.txt --out=/etc/snmp/snmptt.conf --debug --exec='/usr/lib64/nagios/plugins/eventhandlers/submit_check_result $r SNMP_TRAP 2'
轉換成功後的輸出:
Line: 135
NOTIFICATION-TYPE: tsveWTrap
Variables: tsveMACH tsveSERI tsveERRI tsveERRC tsveSWVE tsveFRUP tsveCLUS tsveNODE tsveERRS tsveTIME tsveOBJT tsveOBJI tsveADD1 tsveADD2 tsveCOPY tsveMPNO tsveOBJN
Enterprise: ibm2145TSVE
Looking up via snmptranslate: IBM-SVC-MIB::tsveWTrap
Bad month in timestamp (201517040000Z): At line 15 in /usr/share/snmp/mibs/SVC_MIB_7.5.0.MIB.txt
OID: .1.3.6.1.4.1.2.6.190.2
#
Line: 161
NOTIFICATION-TYPE: tsveITrap
Variables: tsveMACH tsveSERI tsveERRI tsveERRC tsveSWVE tsveFRUP tsveCLUS tsveNODE tsveERRS tsveTIME tsveOBJT tsveOBJI tsveADD1 tsveADD2 tsveCOPY tsveMPNO tsveOBJN
Enterprise: ibm2145TSVE
Looking up via snmptranslate: IBM-SVC-MIB::tsveITrap
Bad month in timestamp (201517040000Z): At line 15 in /usr/share/snmp/mibs/SVC_MIB_7.5.0.MIB.txt
OID: .1.3.6.1.4.1.2.6.190.3
Done
Total translations: 3
Successful translations: 3
Failed translations: 0
錯誤: Could not find DEFINITIONS ::= BEGIN statement in MIB file!
解決: 檢查MIB檔案的第一行格示是否有錯,如下
IBM-SVC-MIB DEFINITIONS ::= BEGIN
snmptt.conf 的內容大致如下:
EVENT tsveITrap .1.3.6.1.4.1.2.6.190.3 "Status Events" Normal
FORMAT tsve information trap $*
EXEC /usr/lib64/nagios/plugins/eventhandlers/submit_check_result $r SNMP_TRAP 2 "tsve information trap $*"
SDESC
tsve information trap
Variables:
1: tsveMACH
2: tsveSERI
3: tsveERRI
4: tsveERRC
5: tsveSWVE
6: tsveFRUP
7: tsveCLUS
8: tsveNODE
9: tsveERRS
10: tsveTIME
11: tsveOBJT
12: tsveOBJI
13: tsveADD1
14: tsveADD2
15: tsveCOPY
16: tsveMPNO
17: tsveOBJN
EDESC
重啟 snmptt 服務
#> service snmptt restart
Nagios 設定完成
設定被監控的設備
IBM V7000)
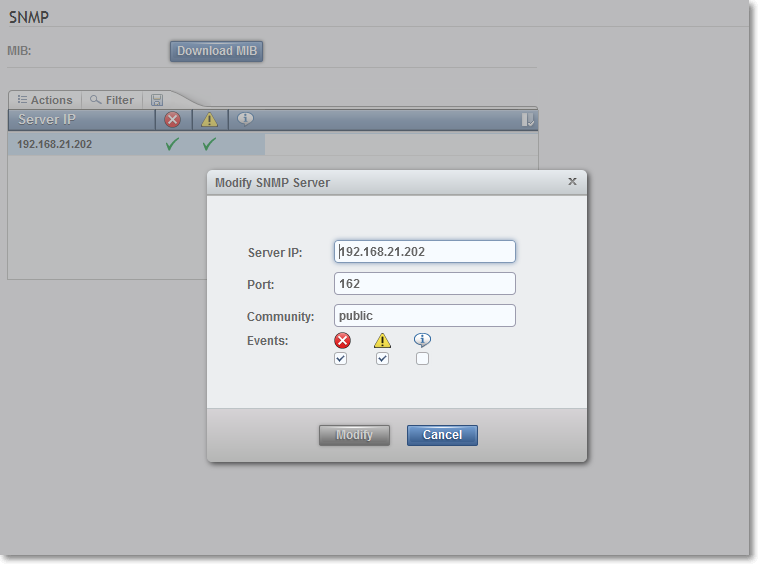
被監控的設備只需要設定 SNMP Trap 功能
IBM V7000 > Settings > Notifications > SNMP > Actions > Add
- Server IP: <輸入 Nagios IP>
- Port: 162 <Nagios 主機上的 snmptrapd 服務通訊埠,一般 snmp trap 的 port 是 162>
- Community: public <建議不要改>
QNAP NAS)
QNAP Admin > System Settings > Network Services > SNMP
- Enable SNMP service: 勾選
- Port number: 161 <NOTE: 這裡的 port 是用於 QNAP 自身的 snmp 服務,與 Nagios 無關>
- SNMP trap level: Warning, Error
- Trap address 1: <輸入 Nagios 主機 IP>
- SNMP version: SNMP V1/V2
- Community: public <NOTE: 這裡是用於 QNAP 自身的 snmp 服務,與 Nagios 無關>
TIPs:
QNAP 的 SNMP 包含了 SNMP 與 SNMP Trap 兩個應用服務,SNMP 可用於蒐集系統的各項資訊,與本篇使用 SnmpTrap 有關的只需要填入 Trap address。

IBM DS 3400/4300/4800 Storage)
必須找一台 CentOS Linux 並安裝 IBM DS Storage Management,將 storage 的 IP 加入軟體的管理。
IBM DS Manager > 選擇要管理的 storage > 按右鍵選 Configure Alerts > SNMP
- Community Name = public
- Trap destination = <Nagios 主機 IP>

測試結果
V7000 測試方法)
V7000 的設備可以拔掉兩個 node 中擔任 standby node 的網路線(不要拔 primary node),系統就會發出一個 Error 的訊息。
V7000 的畫面

Nagios 的畫面

QNAP NAS 測試方法)
要使 QNA NAS 發出 Warning 事件,較安全的做法就是,找一台 Linux 然後執行
$> snmpwalk -v 2c -c public <QNAP IP>
因為 QNAP 預設會啟動 DDos 保護,這個指令會讓 QNAP 發出 SNMP 被攻擊的警告事件。
TIPs:
* 錯誤事件的詳細資訊會被記錄在 Nagios 的 Status Information 欄位。
* 事件發生後,如果 Nagios 沒有顯示,可以檢查 /var/log/snmptt/snmptt.log
- 標籤 (Edit tags)
- 什麼連接到這裡
文件 9
| 文件 | 大小 | 日期 | 附件上傳者 | |||
|---|---|---|---|---|---|---|
 | IBM-DS_SM10_R3.mib MIB for IBM DS 3400/4300/4800 Storage | 7.13 KB | 13:37, 12 Oct 2015 | alang | 動作 | |
| ibm_v7000-snmp.png 無描述 | 28.25 KB | 17:45, 7 Oct 2015 | alang | 動作 | |
| QNAP_NAS.mib MIB for QNAP NAS | 46.01 KB | 15:39, 9 Oct 2015 | alang | 動作 | |
| snmptrap-ibm_DS.png 無描述 | 61.98 KB | 13:34, 12 Oct 2015 | alang | 動作 | |
| snmptrap-nagios.png 無描述 | 54.43 KB | 09:16, 8 Oct 2015 | alang | 動作 | |
| snmptrap-qnap.png 無描述 | 55.45 KB | 15:48, 9 Oct 2015 | alang | 動作 | |
| snmptrap-v7k.png 無描述 | 20.65 KB | 09:16, 8 Oct 2015 | alang | 動作 | |
| snmptt how it works.png 無描述 | 16.37 KB | 16:51, 6 Oct 2015 | alang | 動作 | |
| SVC_MIB_7.5.0.MIB MIB for IBM V7000 Storage | 10.31 KB | 17:47, 6 Oct 2015 | alang | 動作 | |


